Green River | Case Study
State of Delaware
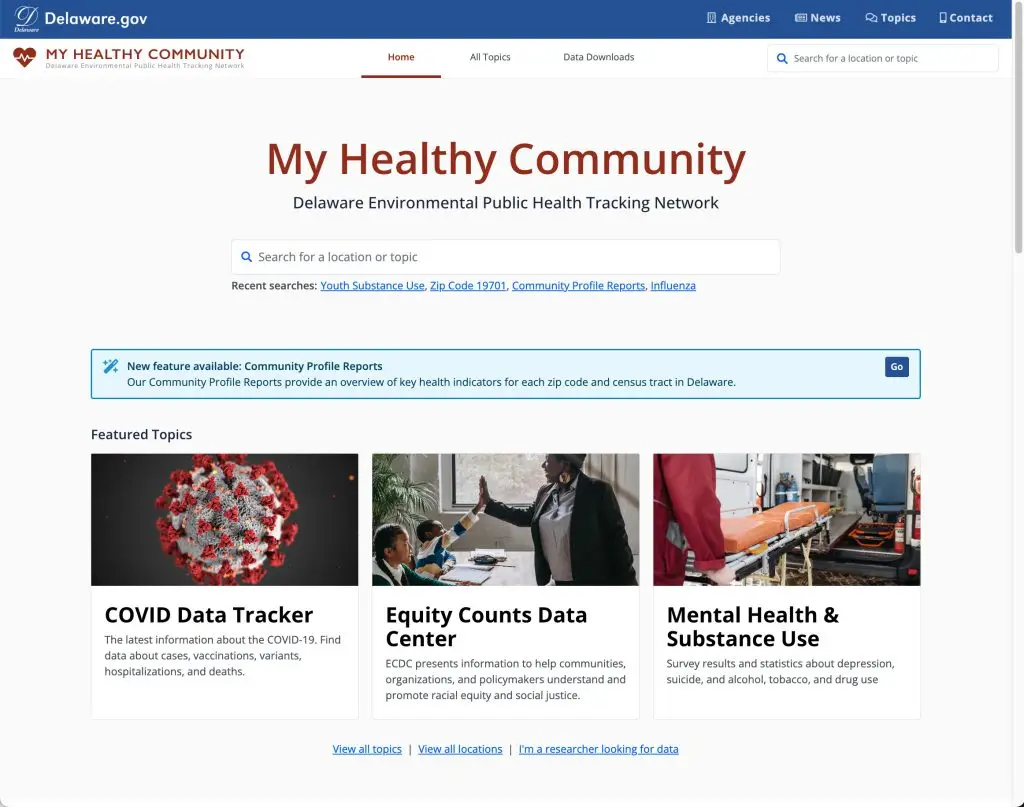
My Healthy Community
A data-rich, interactive public health dashboard for residents, state agencies, and community organizations
Client
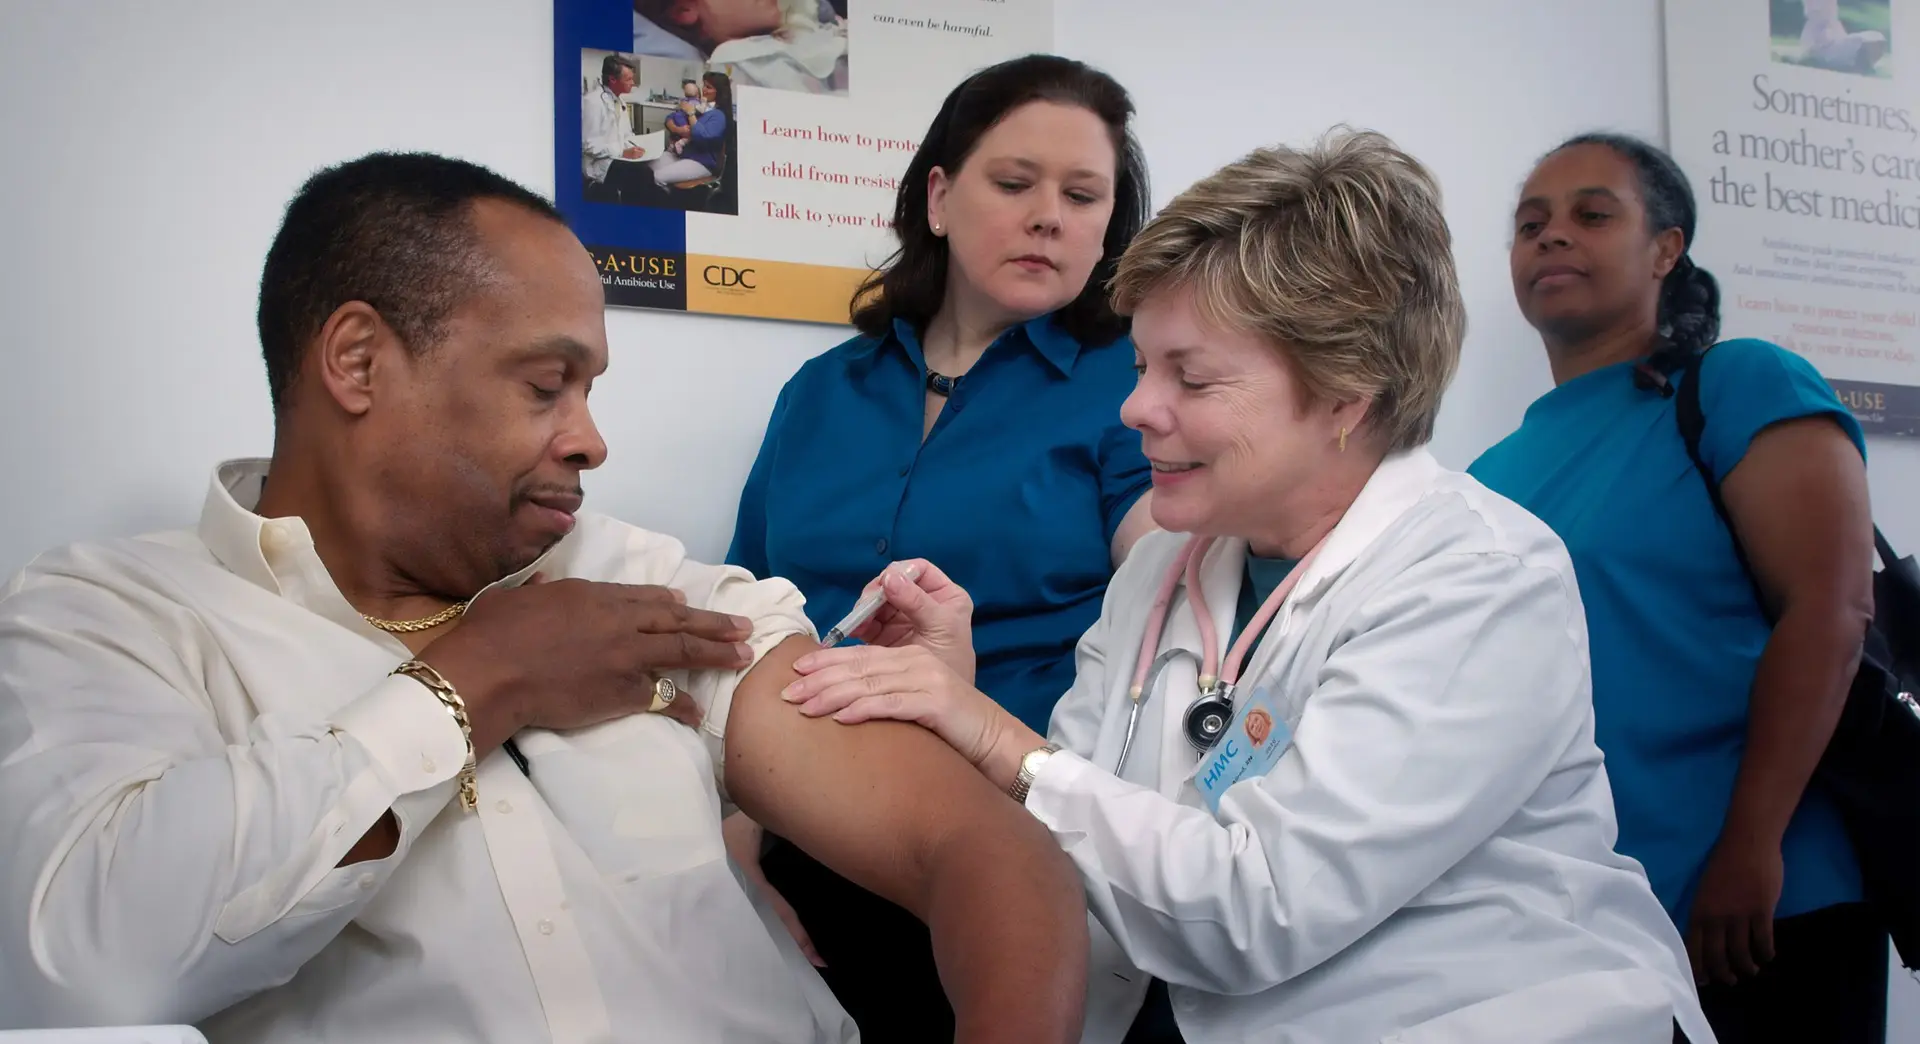
The Delaware Department of Health and Social Services (DHSS) progressively developed an informatics infrastructure for ensuring “Delawareans have access to usable, meaningful, timely, and high-quality data about…the health of the communities in which they live.”
Goal
Build a transparent, accurate, and actionable public health dashboard incorporating neighborhood-level data that focuses on social determinants of health through a myriad of population health areas. The site would also serve as the state’s COVID-19 pandemic-data dashboard and reporting platform.
Outcomes
Software that continuously pulls, integrates, and pushes diverse health data, employing an interactive platform that presents health indicators and outcomes across time via tables, charts, animated maps, and narratives—and doing so at a uniquely granular level.
“MHC is an amazing asset for us as a state in so many ways. Right now, being able to use this platform to bring transparency to the public around Delaware COVID data is huge… Please know the work you do matters greatly.”
KARYL T. RATTAY, MD, MS
Director, Delaware Division of Public Health
Overview
In 2019, DHSS launched My Healthy Community (MHC), an innovative software platform developed with Green River to help state agencies and the public (including community organizations) understand issues impacting health, determine priorities, and enhance decision-making. The platform is the product of a years-long partnership among multiple agencies and stakeholders. MHC delivers neighborhood-granular population, health, environmental, and social determinant data. MHC’s first data layers were drinking water and air quality. By July 2021, it compiled nearly 1,900 indicators from over 30 datasets spanning chronic diseases, mental health and substance use, healthy lifestyles, maternal and child health, health care utilization, and infectious diseases—a depth and range that will only increase.
As the COVID-19 pandemic unfolded in January of 2020, Green River and DHSS rapidly refactored the MHC platform to present data on cases, hospitalizations, emergency department visits, testing, deaths, vaccinations, contact tracing, and in-person contagious school cases. Having MHC operate smoothly for 11 months allowed Green River and DHSS to pivot quickly to make these data available.
Challenge
The nature of public health and public health data—and public health informatics—required DHSS and Green River to innovate several technological solutions to build a useful, informative MHC. For instance, data sets spanning health outcomes, demographics, and social determinants of health (i.e. local conditions affecting risk and vulnerability) originate from many different sources. Each collects data across different timeframes; each updates over various time periods (some daily, some quarterly, some annually); each employs a particular storage format; and each offers a particular granularity (e.g. patient, ZIP Code, county, or state level). Amalgamating this disparate information into a cohesive framework requires very robust data integration processes and software that can merge and present the data in uniform, usable, accessible forms.
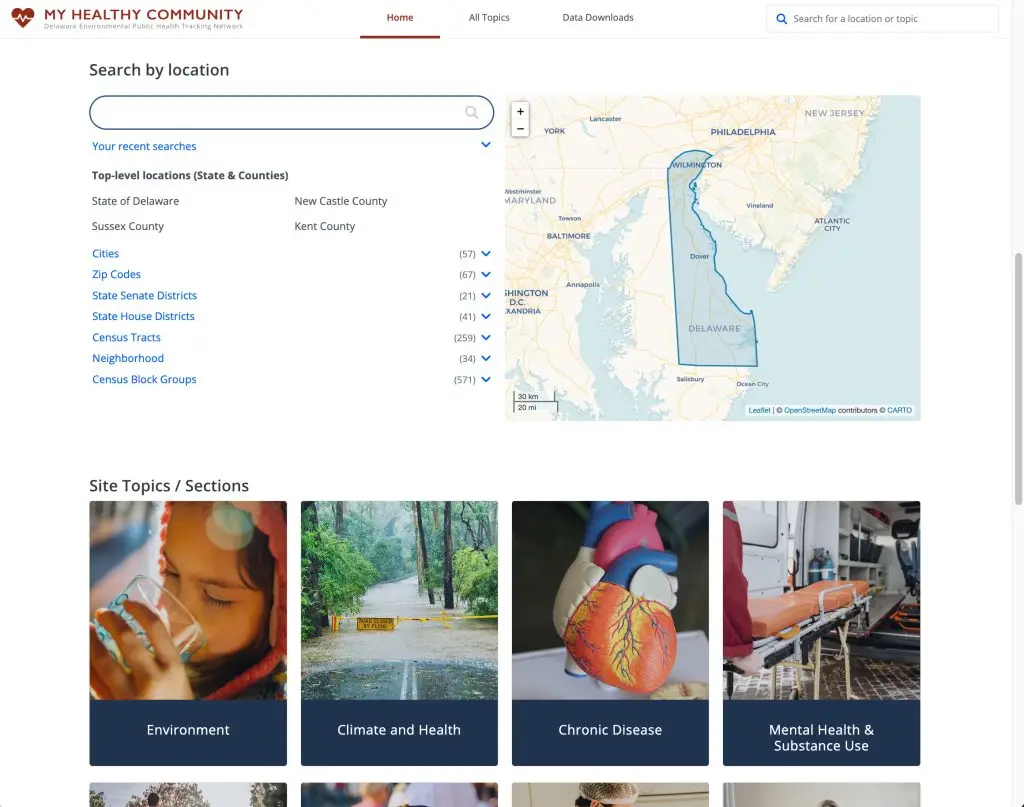
A related user interface and experience (UI/UX) challenge is that, to be effective, MHC must organize information by both health topic and geographic entity. (While hierarchical categorization suffices for much information on the web, public health informatics aims to emphasize relationships between disease, conditions, and demographics.) For MHC, we solved this data-navigation issue by developing an interface that enables simultaneous navigation by both geography and topic.
Finally, local community organizations need detailed, granular, and actionable information to improve health outcomes in their neighborhoods. Yet protecting confidential health information is a paramount concern, and data that is too specific can inadvertently disclose who is sick with what disease. To ensure privacy (and compliance with HIPAA, the Health Insurance Portability and Accountability Act) MHC employs statistical and algorithmical processes to automatically aggregate or suppress data over time, space, or attribute (e.g. an overall cancer category instead of separate types) when the platform encounters specified minimum population counts and/or the more complex situation of disclosure via “incompatible” geographic levels (e.g. data from a smaller unit, like a neighborhood, intersecting data from two larger units, like a census block group).
Process
Green River initiated its work on MHC with a comprehensive discovery process, collaborating with the State of Delaware’s public health team and the project’s point person, Dr. Tabatha Offutt-Powell, the state epidemiologist. We worked with Dr. Offutt-Powell to ascertain the universe of accessible data, priority health topics and indicators, and target audiences. The answers to these questions guided development of the software infrastructure to meet the needs of the entire statewide population. It was an important concern in a state with a distinct mix of regions and localities spanning urban and suburban populations, rural areas, and coastal tourist destinations.
As with all of Green River’s large-scale data projects, we used an iterative process: discovery, development, feedback, improvement, and integration. The mid-project arrival of the COVID-19 pandemic threatened the fluidity of this process, but in fact demonstrated MHC’s robust and flexible infrastructure and the benefits of our client-focused approach. Due to the clarity of the project’s goals and the need to integrate geography, time, and social determinants of health, within weeks DHSS and Green River were able to seamlessly launch a pandemic dashboard with the MHC platform. DPH’s ability to communicate prevalence, testing, and vaccination data in real-time smoothed emergency response efforts.
Solution
MHC enables Delaware residents to develop a rich understanding of health topics in their neighborhoods across time. The platform provides data, data-driven visualizations, and narratives that DHSS hopes will empower policymakers, healthcare providers, and community organizations to build healthier communities.
DPH envisioned a public health informatics platform that functioned as more than a convenient and up-to-date data warehouse and put equity at the center of public health. MHC provides actionable, community intelligence to support, inform, and improve the delivery of coordinated, neighborhood-targeted mitigation strategies, such as vaccine drives and other public health interventions. Its time- and geography-scaling functionalities and social determinants of health data allow users to understand what is happening, to whom, when, and sometimes even why.
On the COVID-19 front, this project has emerged as a top-ranked pandemic dashboard. For COVID-19 reporting, Green River expanded the platform’s menu of health topics and its ability to accommodate multiple data flows. All of these data are processed and presented for accurate and timely government reporting and public consumption at varying levels of spatial and temporal resolution. MHC exemplifies how technology can transform historical approaches to health challenges of this scale, impact, and risk.
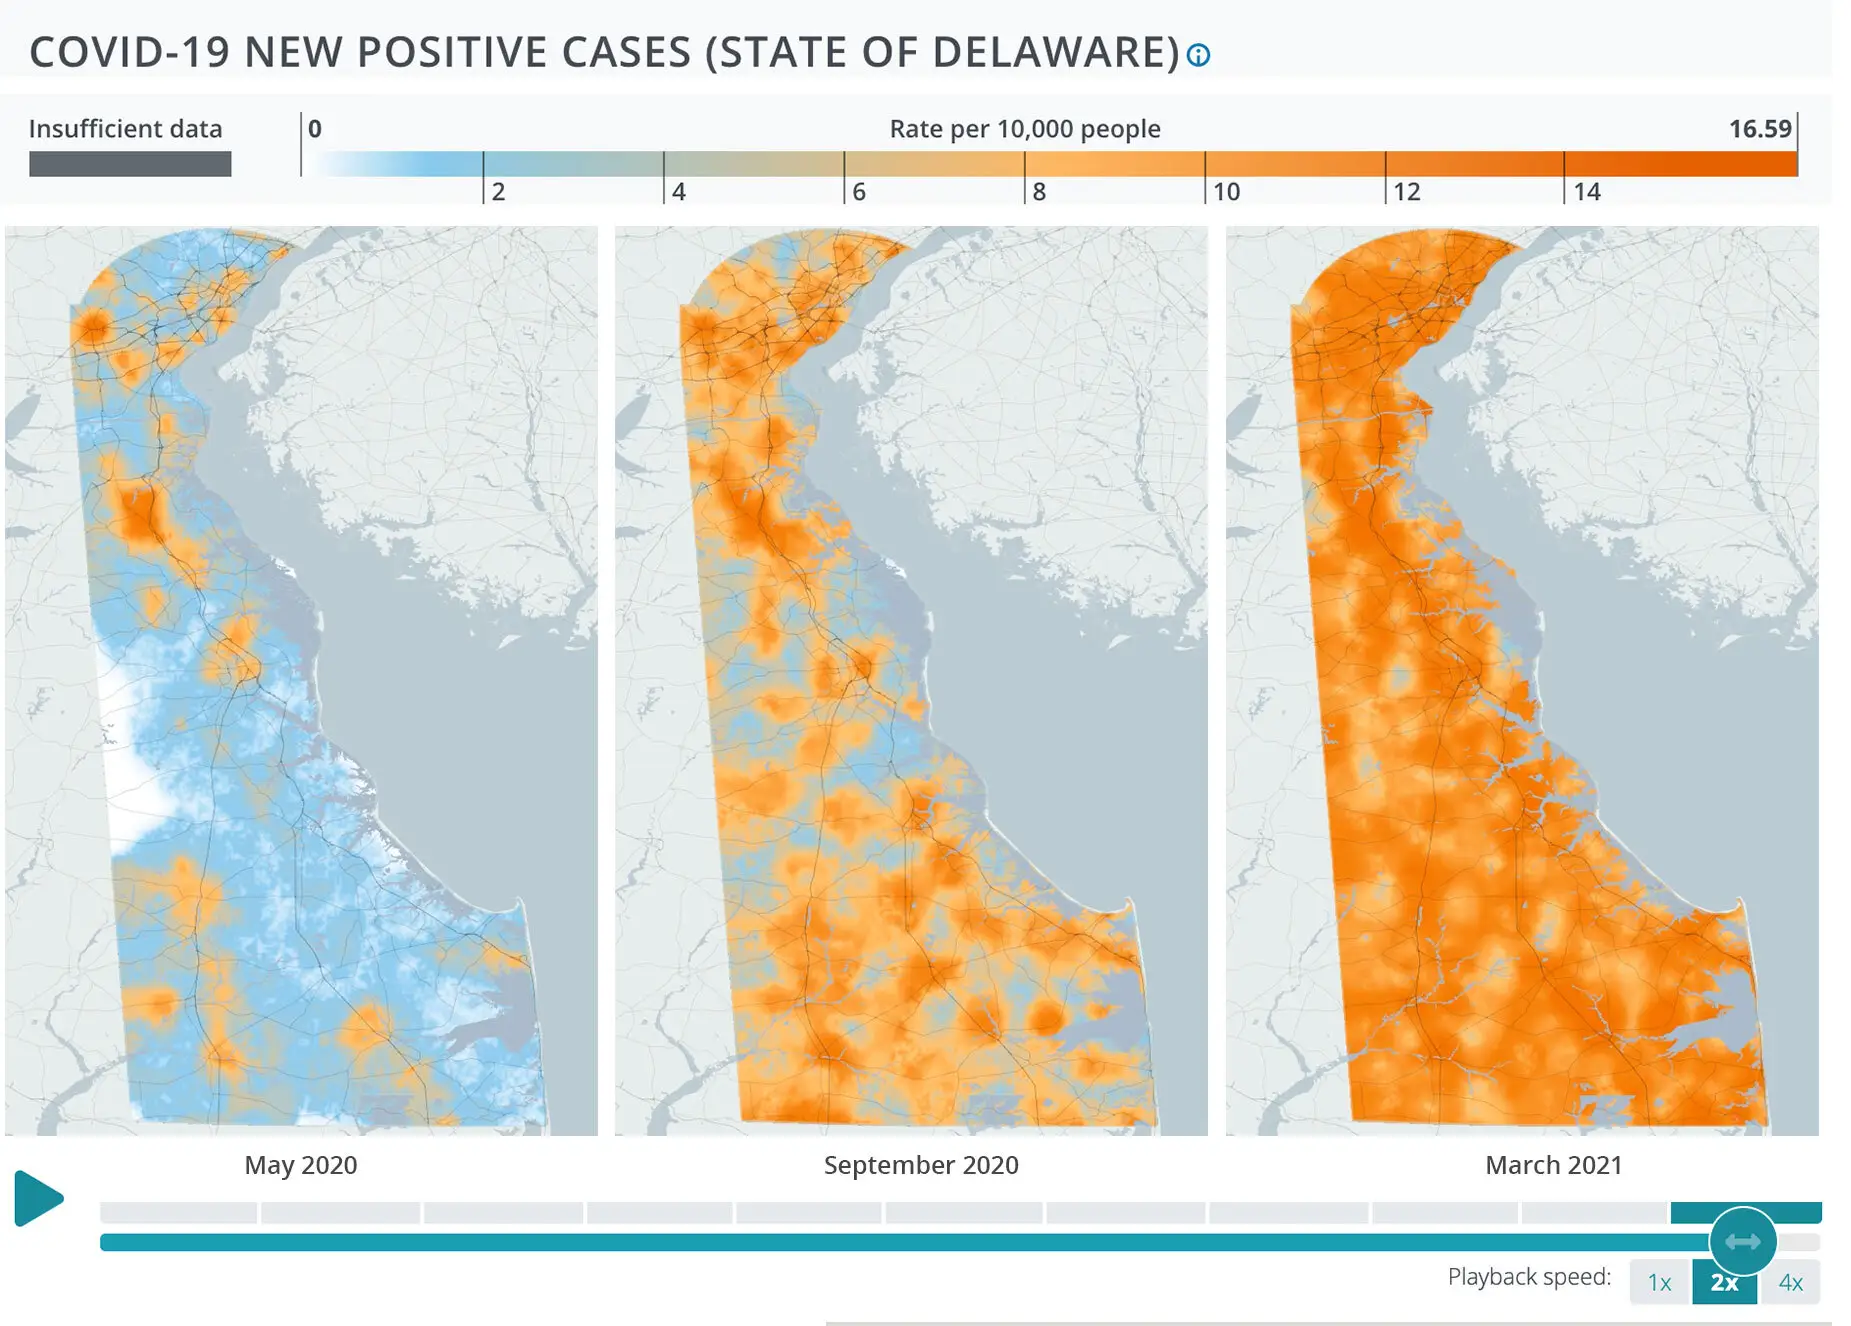
In addition to tables and charts, DHSS’s My Healthy Community features interactive and animated maps to illustrate disease cases and patterns across time and geography. The composite image above depicts an animated heat map describing the prevalence of new positive COVID-19 cases in Delaware from May 2020 to March 2021.
Source: Delaware Department of Health and Social Services, Division of Public Health, My Healthy Community, myhealthycommunity.dhss.delaware.gov/
LEARN MORE
Let’s Build Technology That Strengthens Your Mission
Whether you’re redesigning an aging platform, integrating complex data, or developing infrastructure for high-stakes decision-making, we’re here to help you move from idea to impact.
