







Foundations • Research • Evaluation • Impact

Technology Systems Behind Research and Impact

Research and impact work depends on accurate, connected information. We build the technology systems organizations use to integrate data, evaluate outcomes, and make better decisions.

The Challenge

Why turning information into impact is so complex

Measuring outcomes requires information from many sources, but that information is often fragmented across organizations, programs, and tools.

This complexity often leads to:

When information is fragmented, organizations spend more time managing data and less time generating insight.

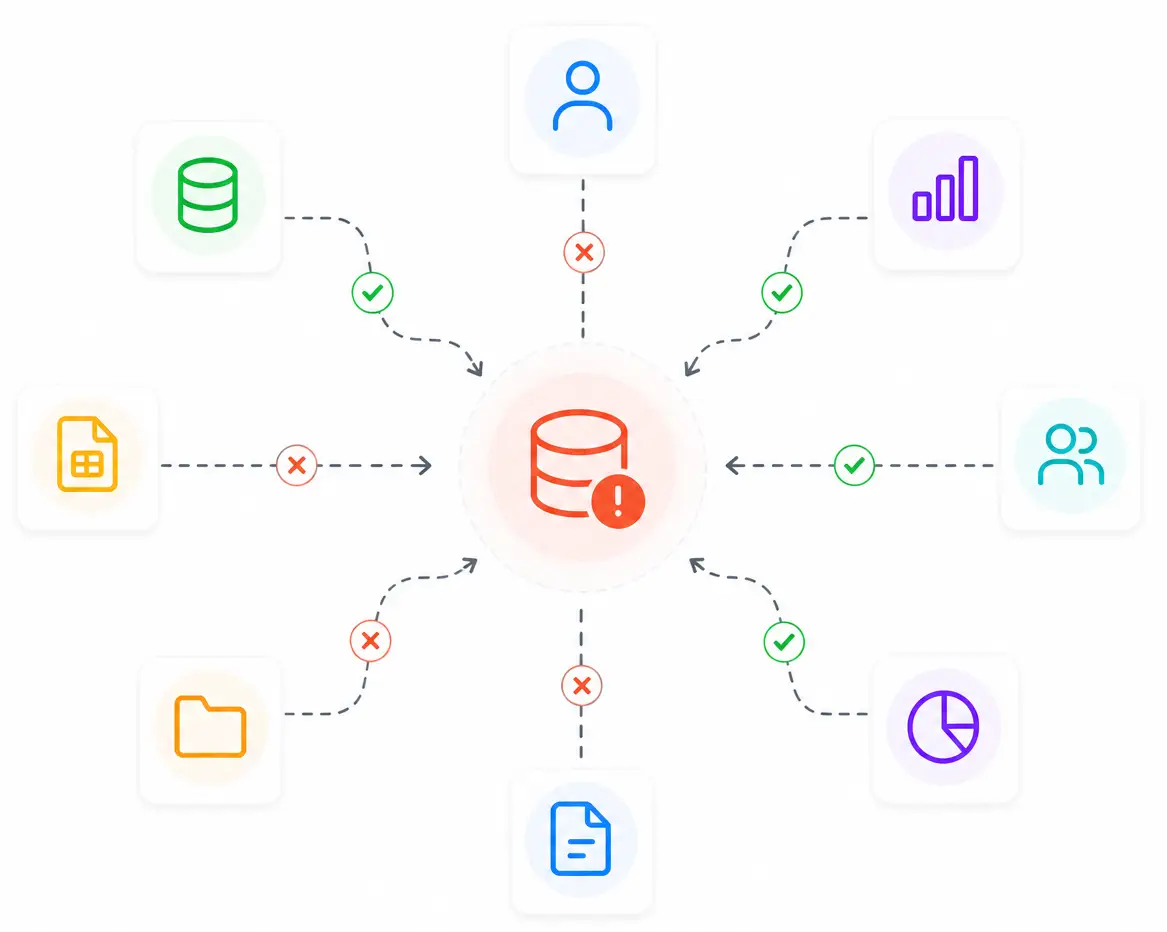
Diagram showing a central database icon with connections to eight surrounding icons, some marked with green checkmarks (access allowed) and others with red Xs (access denied). Icons represent users, files, folders, data types, and Direct Service Organizations.
The Foundation

What strong research systems make possible

Supporting research and impact initiatives takes more than collecting data. It requires technology that connects information, partners, and decision-making.

Organizations need technology that:

A blue outline of a square with a circle at each corner, connected by lines, centered on a light blue circular background—representing the network of community-based organizations working together.

Connects

Integrate information across organizations and initiatives

A green diagram with four circles connected by curved lines and an arrow, symbolizing the workflow of community-based organizations or direct service organizations, on a light green circular background.

Supports

Support research activities and program operations

A purple icon of a bar chart with three vertical bars of increasing height on a light circular background, representing growth often tracked by Community-Based Organizations.

Measures

Provide reliable reporting and analysis

Three orange, outlined, overlapping squares are stacked vertically in the center of a light beige circular background, symbolizing the layered support often provided by Community-Based Organizations.

Scales

Adapt as programs and partnerships evolve

The Solution

Technology designed around how research works

Research and impact initiatives have unique workflows, stakeholders, and reporting requirements. The most effective systems are built around those realities rather than forcing teams to adapt to generic software.

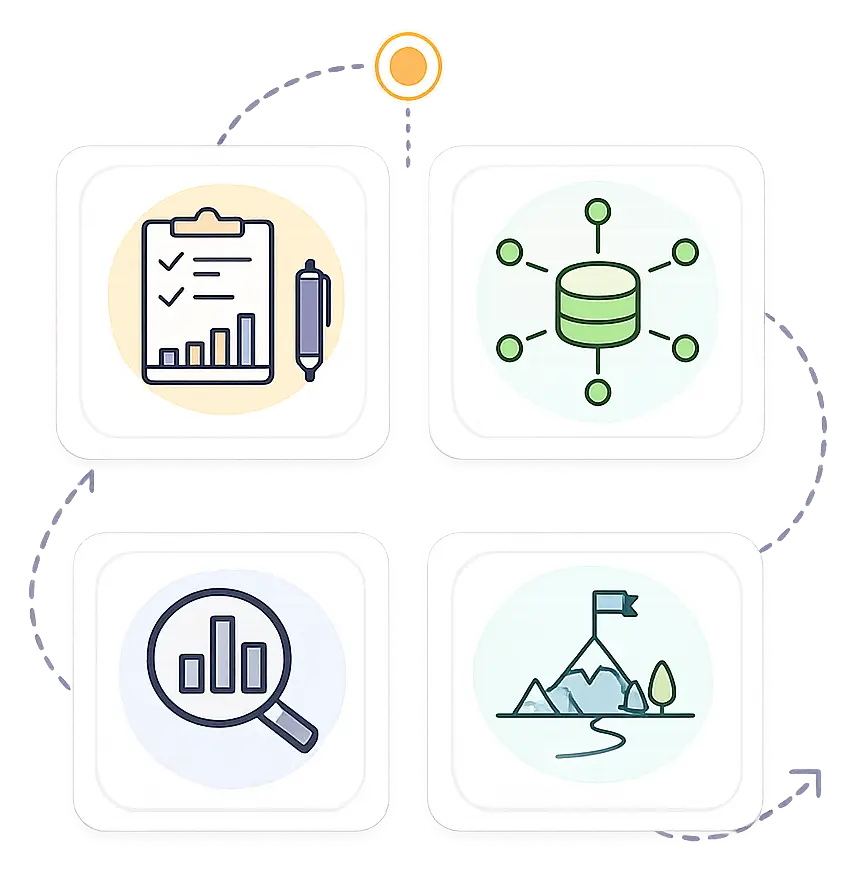
A flowchart with four icons: a clipboard with graphs and a pen, a database with connected nodes, a magnifying glass over a bar chart, and a flag on a mountain path—illustrating how research drives impact organizations toward their philanthropic goals.
What we bring

The expertise behind effective research systems

Research technology succeeds when strategy, data, design, and engineering work together—not in isolation.

Simple orange compass icon with a pointed needle, centered on a light circular background—ideal for community-based organizations and direct service organizations seeking clear direction.

Understand

We align technology investments with research goals and organizational priorities.

Blue line icon of a web browser window connected to a square and circle, symbolizing digital workflow or website structure for Direct Service Organizations, on a light blue circular background.

Connect

We design systems around how your research, evaluation, and reporting teams actually work.

Pink icon showing three connected circles above four staggered horizontal bars, resembling a simple project timeline or workflow for Community-Based Organizations within a light pink circular background.

Build

We help guide priorities, roadmaps, and long-term platform evolution.

A simple green line icon of a cylindrical database with three stacked sections and small circular dots on the right, representing data for Community-Based Organizations, set against a light green circular background.

Evolve

We connect information across studies, programs, and partner organizations.

A purple line drawing of a web browser window with a code symbol inside, connected to three circles below, representing community-based organizations, all on a light purple circular background.

Software Development

We develop technology that supports data collection, analysis, and reporting.

Blue line drawing of a cloud with a shield in front, inside a light blue circle, symbolizing secure cloud storage for Community-Based Organizations or protected data for Direct Service Organizations.

Infrastructure

We keep research systems secure, reliable, and ready to scale.

Before & After

What changes when technology supports research

The right technology helps research teams spend less time assembling information and more time generating insight.

Our Process

How we work with your team

We start by understanding how your programs operate. Then we design, build, and support technology that strengthens those programs over time.

01
A magnifying glass overlays three connected yellow circles, representing analysis or examination of data or connections within Community-Based Organizations.
Understand
Research goals, stakeholders, and data
A gray horizontal line with a circle in the center and short lines extending to the left and right sides, symbolizing the connections formed by Community-Based Organizations.
02
Blue line icon of a web browser window with connected nodes and rectangles, symbolizing the website structure or workflow of Direct Service Organizations or Community-Based Organizations, on a light circular background.
Connect
Integrate systems and information
A gray horizontal line with a circle in the center and short lines extending to the left and right sides, symbolizing the connections formed by Community-Based Organizations.
03
A purple line drawing of a web browser window with a code symbol (“< >”) in the center and three connected dots below, representing coding or web development for Community-Based Organizations.
Build
Reporting, analytics, and workflows
A gray horizontal line with a circle in the center and short lines extending to the left and right sides, symbolizing the connections formed by Community-Based Organizations.
04
A simple blue outline of a shield surrounded by two circular arrows, symbolizing protection, security, or continuous safety for community-based organizations. The icon is set against a light blue circular background.
Support
Continuous improvement. Long-term support
What Strong Systems Make Possible

When strong systems support research and impact, teams can focus on what matters

The right technology helps research and impact teams spend less time managing data and more time generating insight. Strong systems make it easier to integrate information, measure outcomes, and support better decisions.

The result is less time managing information—and more time advancing research and impact.

A woman sits at a desk with a laptop, surrounded by paperwork and plants. Graphs and charts highlighting impact organizations are displayed on the wall. Sunlight streams through a window with a city view. The scene is tidy and focused on research and data analysis.
Real World Impact
Helping organizations turn data into decisions

Every organization measures impact differently. We build technology that helps teams collect better data, understand outcomes, and share meaningful results with the people who depend on them.

Next Steps
Let’s build technology that strengthens your mission

Research and impact organizations rely on trusted information to make important decisions. We build technology that helps your team collect better data, measure outcomes, and demonstrate the difference your work makes.

Request an open path demo

Let's have a chat